CAPY-Q.tab
Efficient data analysis of complex process data with fast and user-friendly Excel import
What is CAPY-Q.tab
CAPY-Q.tab is analysis software that has been developed for industrial requirements. Thanks to the uncomplicated import of existing process data from Excel files, every user is ready to start their first analysis in just a few minutes.
Small or large data sets with few or many parameters, linear or highly non-linear cause-effect relationships or even input correlations can be processed. With CAPY-Q.tab, almost all sensitivity effects can be identified and visualized quickly and efficiently without in-depth statistical knowledge.

Highlights of CAPY-Q.tab
Sensitivity analysis
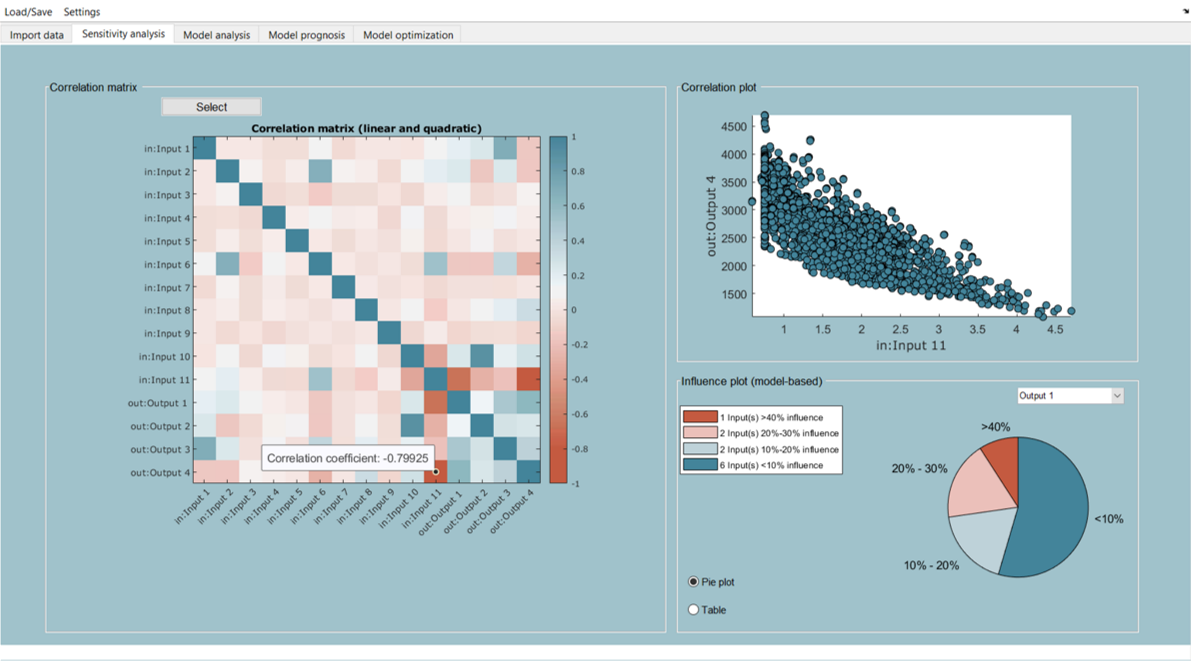
Identify the effects of various process parameters on your quality-relevant outputs using our sensitivity module.
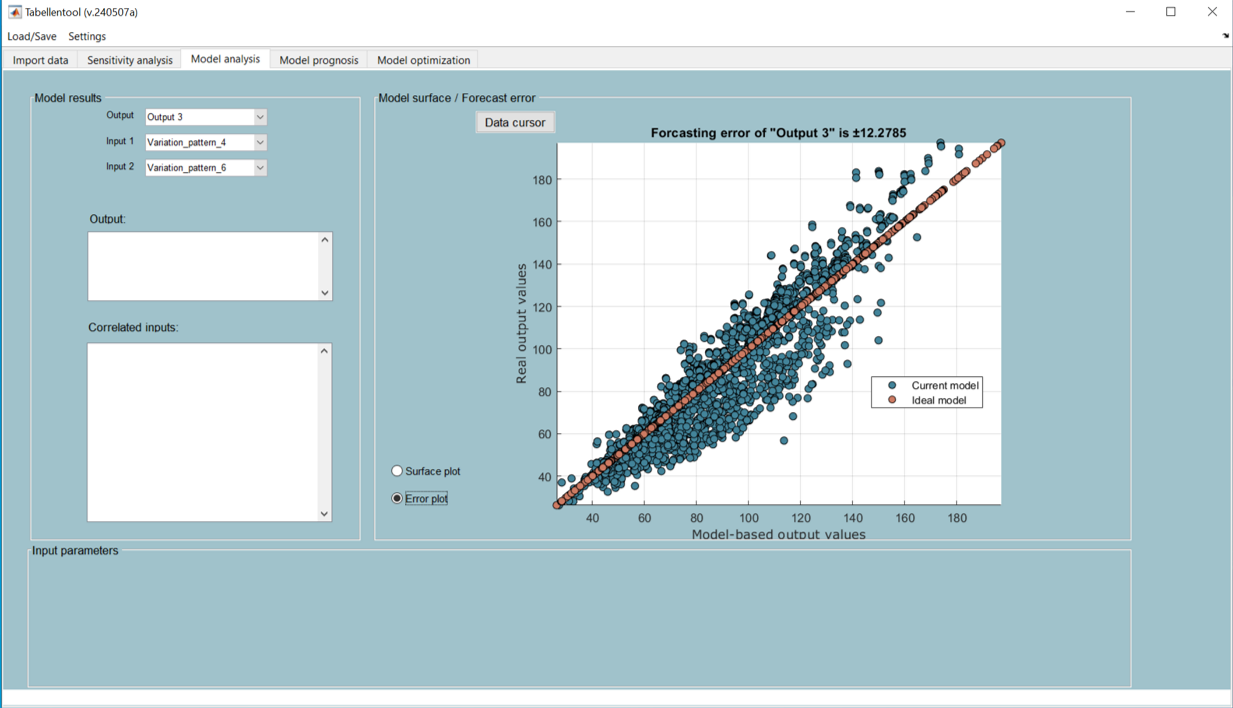
Model prognosis
Our powerful self-learning algorithm automatically selects the optimal correlation model for your data
Model optimization
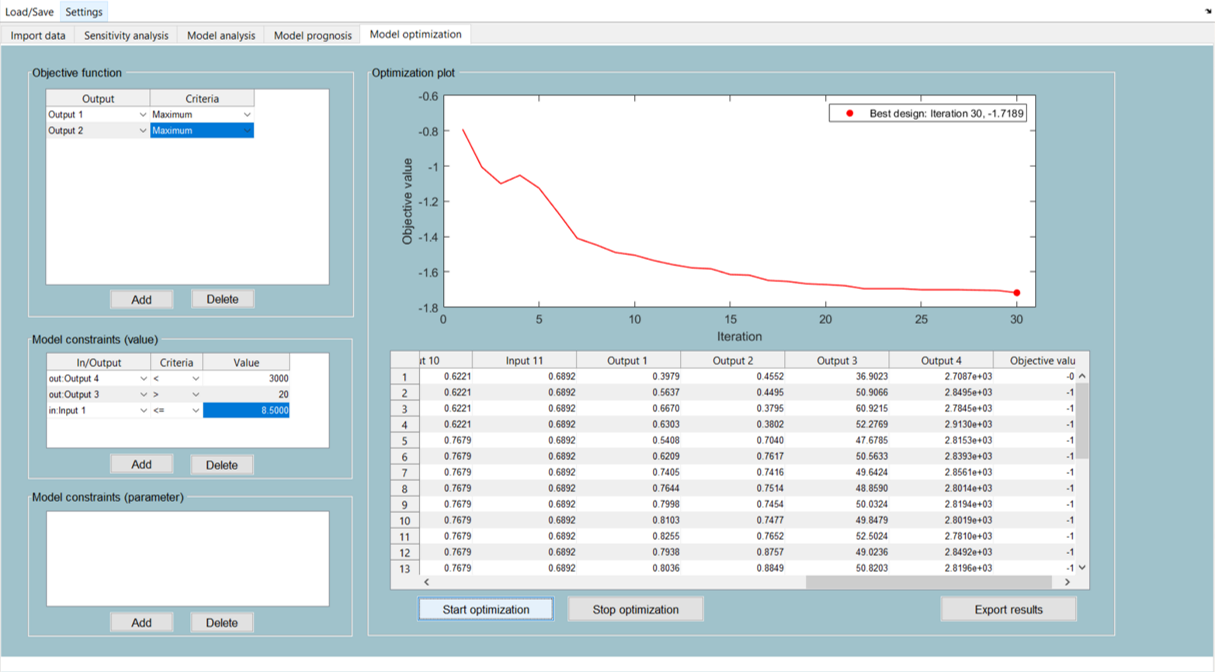
Improve your production processes with our specially developed solutions for process optimization.
Benefits of CAPY-Q.tab
- Simple Excel import of existing tables
- First analysis results within a few minutes
- Analysis of small and large data sets
- No DoE required
- Decorrelation of input parameters
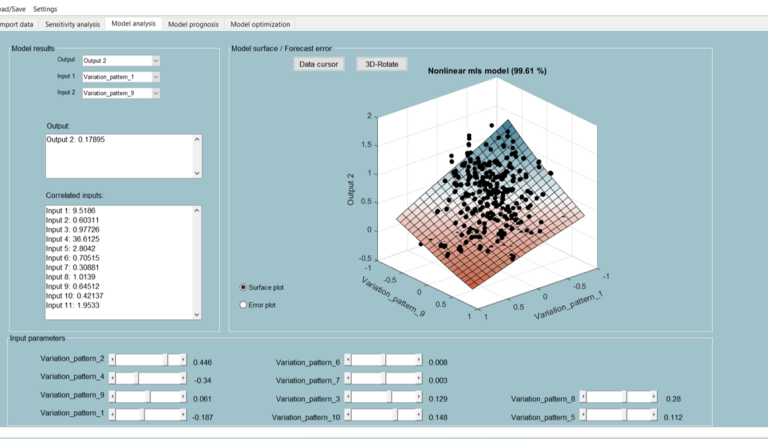
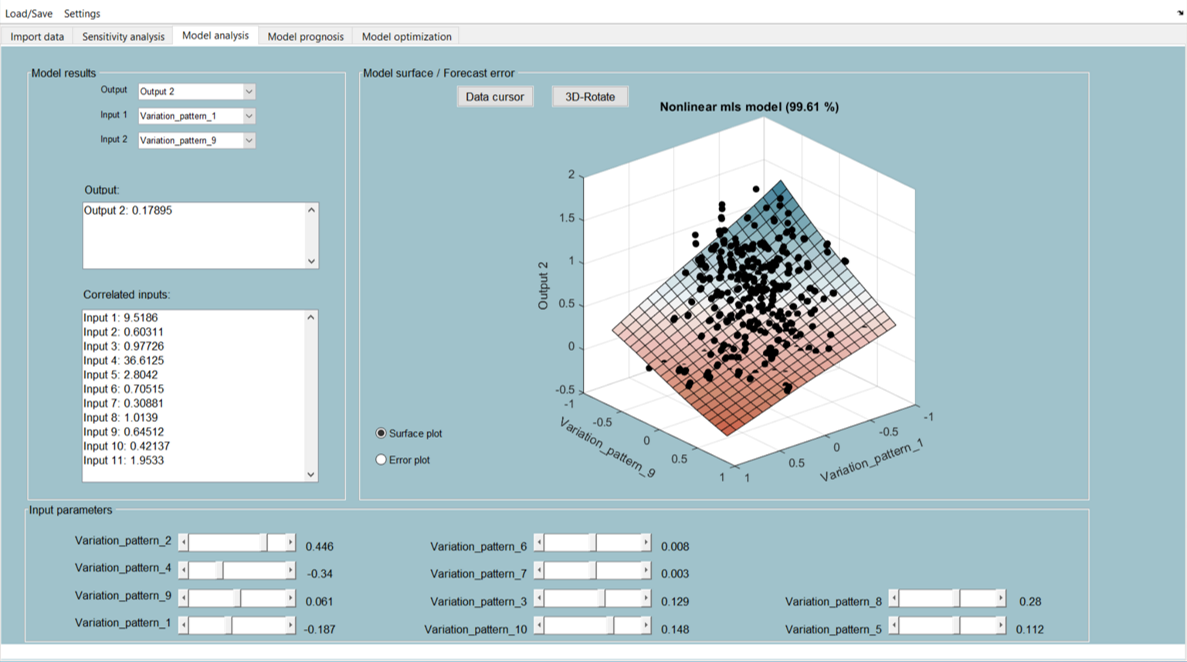
- Automated model creation using linear and non-linear approaches
- Sensitivity and correlation analysis to identify process-relevant inputs
- Model-based forecasting of new data sets
- Evolutionary optimization of inputs and outputs taking into account boundary conditions